

Key Takeaways
- An audiogram visually displays your hearing thresholds as a graph of frequency versus decibel level.
- Air conduction and bone conduction results on the same chart reveal whether hearing loss is conductive or sensorineural.
- Thresholds at 25 dB or better across all frequencies are considered normal hearing levels.
- Symmetrical results mean both ears hear alike, while asymmetrical results need prompt evaluation.
- Most insurance plans help cover a diagnostic audiogram test.
- You can schedule a hearing test with our team at (813) 345-8135 to get your own audiogram results.
What Is an Audiogram?
An audiogram is the graph that shows your hearing test results, and it is the foundation of every diagnosis we make at Ear to Hear. If you have noticed changes in your hearing, an audiogram test gives you clear answers about your hearing levels. Our licensed specialists perform audiogram tests at every one of our hearing clinics across Florida, Illinois, and Missouri.
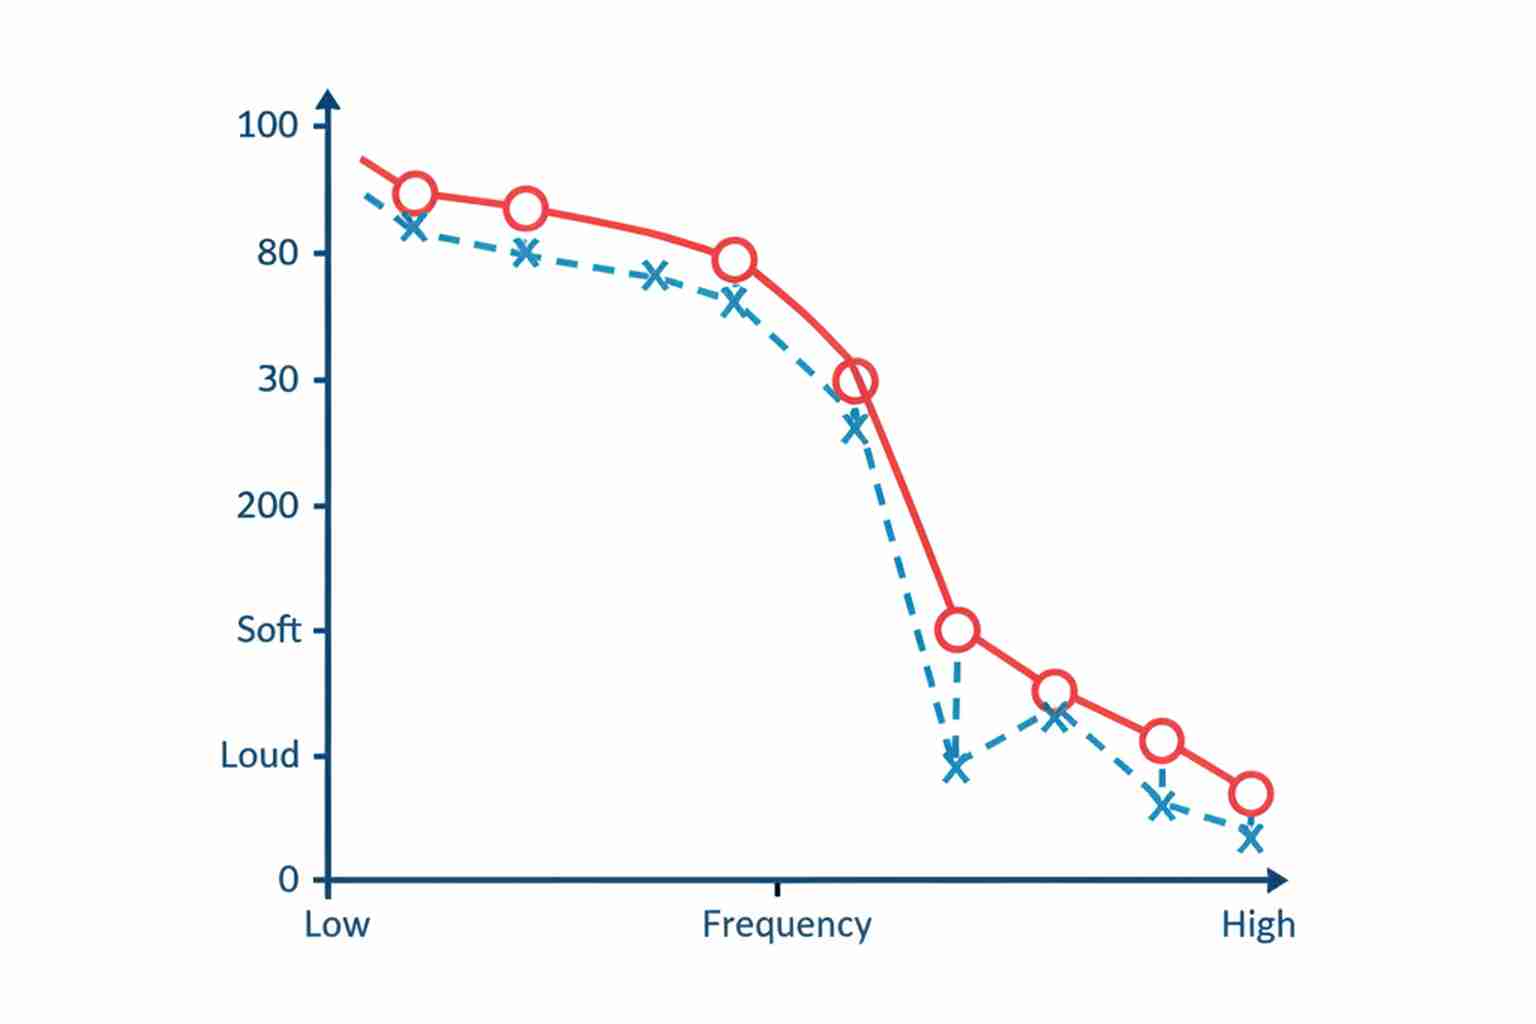
An audiogram is a graph that shows how well you hear sounds at different pitches and volumes. The horizontal axis maps frequency in Hertz, while the vertical axis maps loudness in decibels. Every mark on the chart represents your hearing threshold, the softest sound you can detect at least half the time.
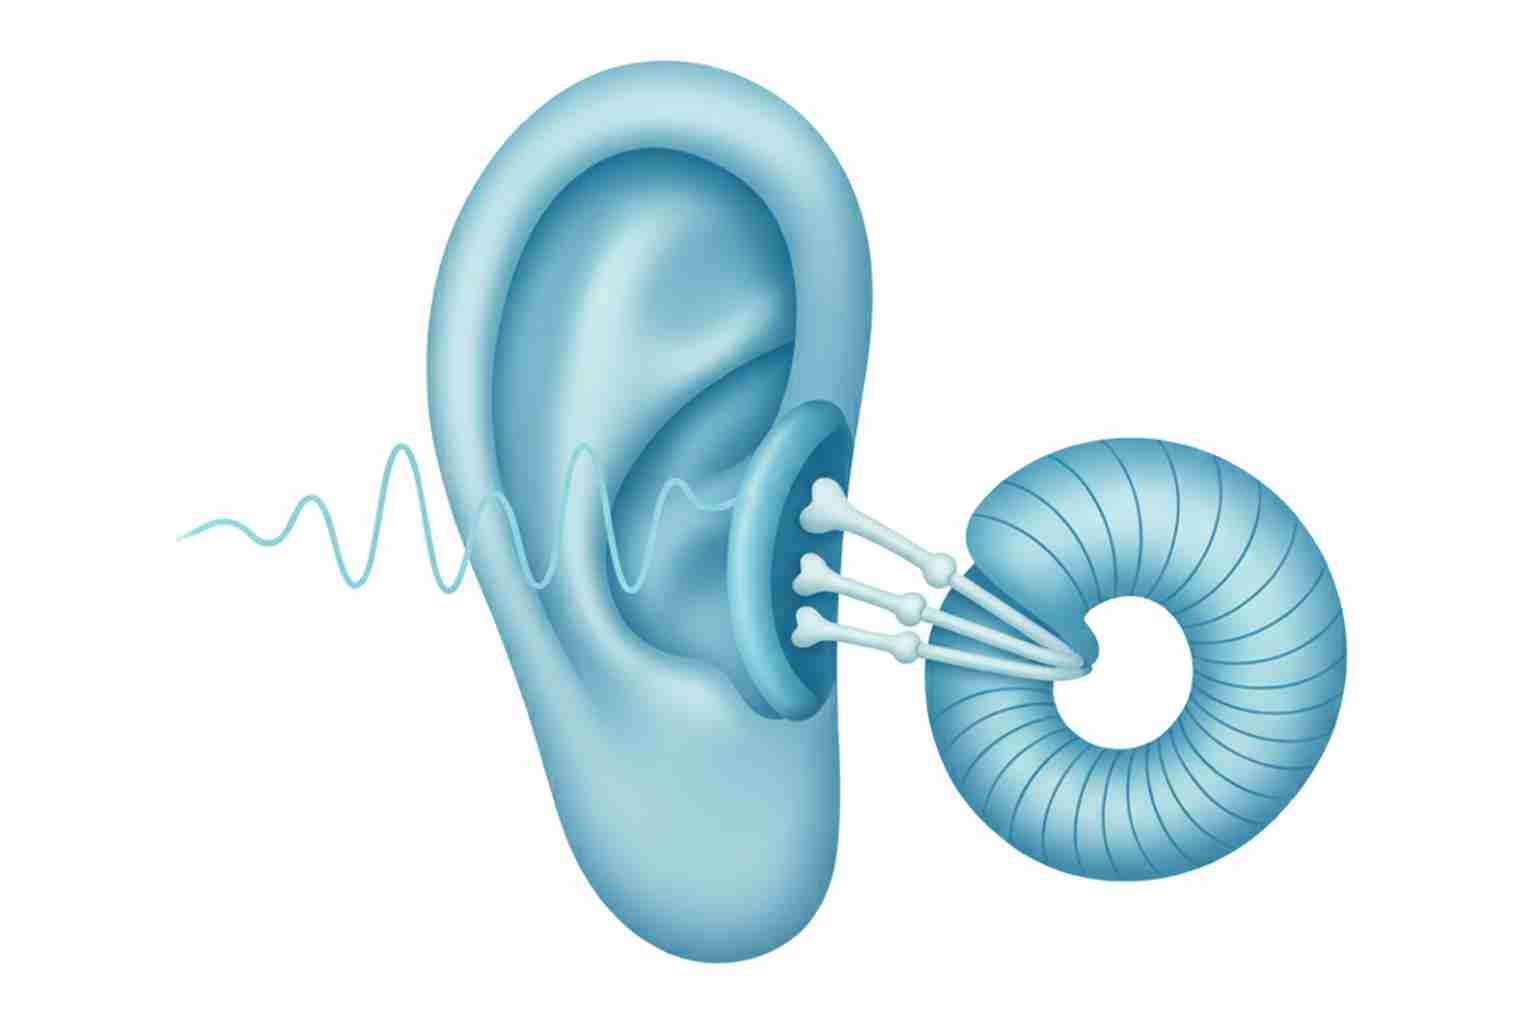
When our team measures these hearing thresholds, we test both air conduction and bone conduction. Air conduction checks the full pathway from your outer ear to the cochlea. Bone conduction sends sound vibrations directly past the middle ear and tests the inner ear alone.
That comparison is what makes audiogram interpretation useful. If bone conduction is normal but air conduction is poor, the problem sits in the outer or middle ear. When both drop together, the loss traces to the inner ear or hearing nerve.
How an Audiogram Test Works
An audiogram test is painless and takes about 30 minutes at our clinics. Here is what happens:
- You sit in a sound-treated booth wearing headphones.
- The audiologist looks in your ears to rule out wax blockage.
- You raise your hand or press a button when you hear a tone.
- A speech test checks how clearly you understand words.
The tones drop softer until you miss them. That tipping point becomes your threshold at each frequency. Most audiogram results also include a word recognition score, which shows how well you process speech.

How to Read Audiogram Results
Audiogram interpretation starts with the shape of the line, not any single mark. Normal hearing levels sit at 25 dB or better at every frequency. Mild loss falls between 26 and 40 dB, moderate between 41 and 55 dB, severe between 71 and 90 dB, and profound above that.
Reading Frequency on the Horizontal Axis
Low frequencies on the left, like 250 Hz, carry vowel energy. High frequencies on the right, from 4000 to 8000 Hz, carry consonant sounds like s, f, and th. Most age related hearing loss slopes down at the high frequencies first, which is why clarity suffers before volume does. A pure tone dip near 4000 Hz often follows noise exposure.
Reading the Marks on the Chart
Right ear air conduction marks are red circles, and left ear marks are blue X symbols. When air conduction sits 15 dB or more below bone conduction, that air bone gap points to a middle ear problem.
Degrees of Hearing Loss on an Audiogram
- Normal: 0 to 25 dB - You hear soft speech, whispers, and birds.
- Mild: 26 to 40 dB - You miss quiet conversation in restaurants.
- Moderate: 41 to 55 dB - Normal speech becomes hard to follow without hearing aids.
- Severe: 71 to 90 dB - Only loud voices reach you clearly.
- Profound: above 90 dB - Most sounds are undetectable.
One number never tells the whole story. Two people with a 45 dB threshold can hear very differently depending on which frequencies dropped.
Air Conduction vs Bone Conduction Results
The relationship between air and bone thresholds classifies your hearing loss type. A conductive loss shows normal bone conduction with elevated air thresholds, meaning sound cannot pass through the outer or middle ear. Fluid, wax, or a fixed middle ear bone often causes it.
A sensorineural loss shows air and bone thresholds dropping together, which points to the cochlea or hearing nerve. Presbycusis, noise damage, and sudden hearing loss all follow this pattern. A mixed loss shows both. This classification matters because conductive loss may clear with medication, while sensorineural loss responds best to properly fitted hearing aids.
What a Normal Audiogram Looks Like
A normal audiogram shows thresholds at 25 dB or better at all tested frequencies for both ears. The line stays near the top of the chart, and both ears track closely together. Speech understanding scores typically sit at 90 percent or higher.
Small variations are common and usually harmless. A slight dip at 4000 Hz from an old noise exposure, called a noise notch, is one of the most frequent findings we see in adults. If your hearing test shows this pattern, we monitor it yearly.
Common Audiogram Patterns and What They Mean
The shape of your audiogram often matches a specific cause. Flat loss suggests a middle ear issue or advanced inner ear damage. A ski slope loss that drops sharply after 2000 Hz is the classic age related pattern. A cookie bite loss can be hereditary.
A unilateral loss affecting only one ear always needs a full workup, because it can signal a condition that needs imaging. If your audiogram results show a significant difference between ears, do not wait for it to improve.
What Happens After Your Audiogram Results
Your audiogram results turn into a plan the same day. For normal results, we recommend a baseline and yearly monitoring. For mild to moderate loss, we discuss whether hearing aids fit your lifestyle. For sudden or asymmetric findings, we refer for medical evaluation quickly. We also review rechargeable hearing aids and Bluetooth hearing aids options based on your results.

How Much Does an Audiogram Cost?
A diagnostic audiogram test at Ear to Hear typically costs between 50 and 150 dollars out of pocket when insurance does not cover it. Medicare Part B covers a diagnostic audiogram when your doctor orders it to evaluate a medical concern. Our team verifies your benefits before your visit.
We also offer free hearing screenings that take about 10 minutes and tell you whether a full workup makes sense. Call us at (813) 345-8135 and we will check your coverage, or schedule an appointment online.
Frequently Asked Questions
An audiogram test measures your hearing thresholds across the speech frequencies, from 250 to 8000 Hz, in both ears. It shows the softest pure tone you can hear at each frequency and how well you understand words.
Most patients pay between 50 and 150 dollars in cash, though many insurance plans and Medicare supplements reduce or cover the cost when ordered to evaluate a hearing concern.
A good audiogram shows thresholds at 25 dB or better across all frequencies and speech scores of 90 percent or higher. Results in that range need no treatment beyond routine monitoring.
A normal audiogram shows both ears detecting sounds at 25 dB or softer at every tested frequency, with the air conduction and bone conduction lines overlapping.
References
- StatPearls. "Audiometry." NCBI Bookshelf. https://www.ncbi.nlm.nih.gov/books/NBK578179/
- Johns Hopkins Medicine. "Understanding Your Audiogram." https://www.hopkinsmedicine.org/
- Starkey. "What Is an Audiogram?" August 2023. https://www.starkey.com/
- University of Iowa Health Care. "How to Read an Audiogram." https://iowaprotocols.medicine.uiowa.edu/
- ASHA. "Types of Hearing Loss." https://www.asha.org/
Ready for clear answers about your hearing? Schedule a free hearing test or call us at (813) 345-8135.